Wednesday, March 30, 2011
Renders of Iterations
Grasshopper Document
 Originally I had the lofting and piping occuring from the same point within the double diagram. To gain the best effect of the concept of deterioration I needed to use and manipulate the flowgraph for both aspects, toggling sliders to different levels on each surface. By copying the flowgraph in two locations, it is easier to manipulate the two surfaces separately to gain a better effect.
Poster Text
Monday, March 28, 2011
Week 4 - Models


INTERESTING COMBINATIONS OF SURFACE STYLE:
 Loft and Pipe
  Loft and Pipe
  Pipe and Sum Surface
  Pipe and Loft
  Pipe and Loft
MINIMAL STRUCTURE REFLECTING MAXIMUM OSTEOPOROSIS:
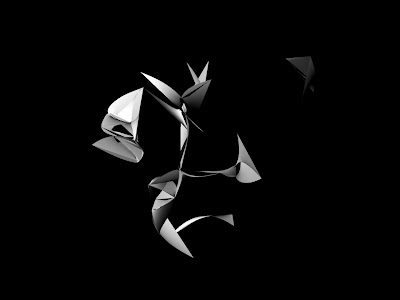
 Minimum Value Iteration
  Minimum Value Iteration
  Minimum Value Iteration
  Minimum Value Iteration
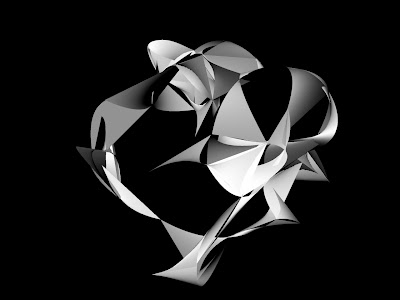
Mid Range Iteration
 Mid Range Iteration
  Mid Range Iteration
  Mid Range Iteration
  Mid Range Iteration
DIFFERENT SURFACE TYPES:  Sum Surface Model
SINGLE MODEL SHOWING MINIMAL, MID RANGE AND MAXIMUM OSTEOPOROSIS:
 Minimum Values
  Mid Range Values
  Maximum Values
THE NUMBER OF POINTS TO SPLIT AT PROVIDES GREATER/LESSER COMPLEXITY OF STRUCTURE:
 Splitting Points Index 70
  Splitting Points Index 50
  Splitting Points Index 30
REDUCING RADIUS TO SEARCH FOR POINTS TO JOIN REDUCES THE COMPLEXITY OF THE STRUCTURE:
Proximity - Optimum Maximum Search Radius 35
 Proximity - Optimum Maximum Search Radius 25
  Proximity - Optimum Maximum Search Radius 15
  FINDING MAX NO OF CLOSEST POINTS INCREASES/DECREASES COMPLEXITY OF STRUCTURE:
 Proximity - Maximum Number Of Closest Points To Find 6  Proximity - Maximum Number Of Closest Points To Find 4
  Proximity - Maximum Number Of Closest Points To Find 3
  NUMBER OF VALUES IN SERIES GIVES INCREASED NUMBER OF JOINTS:
Number Of Values In Series 20  Number Of Values In Series 15
  Number of Values In Series 10
JITTER SHUFFLE REFLECTS A CRUSHING OF THE STRUCTURE:
Jitter Shuffle Value 1.0
 Jitter Shuffle Value 0.6
  Jitter Shuffle Value 0.2


